“When you can count, count.”
— Skip Fischer
When I was training to be a historian, I suppose starting with MA work, I managed to internalize the notion that “real” historians crunched data, drew conclusions from it, and presented it to their audience in the form of tables and graphs. One thing that most of the “real” history books I was assigned to read had in common was lots of tables and graphs. It would be reasonable to assume, then, based on what I just wrote, that I began to pay special attention to these tables and graphs, with a growing ambition to create my own as I developed into a “real” historian myself.
Reasonable such an assumption might be. It would also be wrong. I disliked tables and graphs. I never read them. My attitude was—and to some extent, still is—that the author had better tell me what conclusions are to be taken away from the tables and graphs without my actually having to peruse them. When I read a book, I want to read words strung together in well-crafted English. I do not want to look at numbers and make my brain do math.
The next reasonable assumption might be then, that I had a problem: I was training to be a “real” historian, I had internalized that “real” historians do research that results in tables and graphs, and yet I disliked tables and graphs, and thus was unlikely to want to do research that would lead to my producing them. This assumption would be correct. As superficial as it may come across, I think that helps explain why thirteen years passed between finishing my MA and beginning my PhD.
Doctoral training is, of course, literally on a whole other level, so I learned that “real” historians do all sorts of things, and by no means must one do the sort of research that leads to the production of tables and graphs. Nevertheless, as my study progressed, I realized that where it was headed was a shelf of books full of—yep—tables and graphs, so much so that I found myself often having to say to myself in my head, “I am not an economic historian, I am not trying to become an economic historian.” That was important, as I have had precisely one economics course in my academic career, as a college sophomore, and my performance in it was less than remarkable.
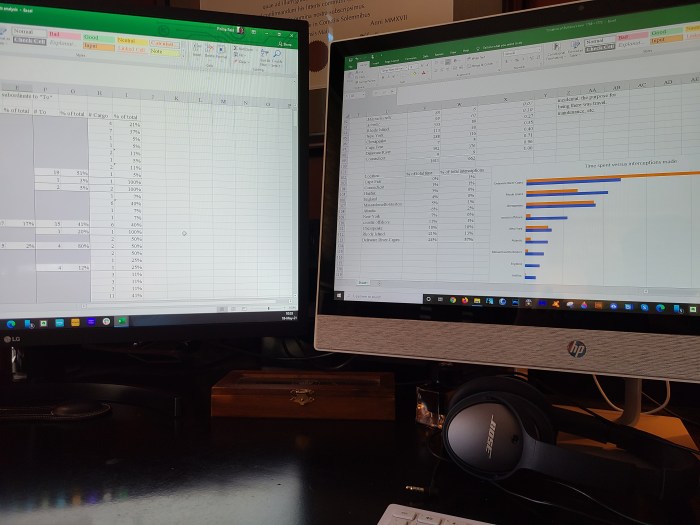
I found my way, and here I am, five years out, in the late stages of research for this second book. I’m still not an economic historian and have no ambition of becoming one. Yet, as you can see from the image that accompanies this post, I am sitting here producing—tables and graphs. What’s weirder than that is how much I am enjoying it.
I think this is best explained by an adage that has proved among the more generally applicable to life so far as I can tell. It can be expressed something like this: It’s striking how one can suddenly develop a keen interest in learning and using a skill for which, in the past, one had no such interest, when that skill proves necessary to accomplish something about which one actually gives a damn. I think this also gets at a perennial problem of pedagogy: trying to teach students skills and knowledge you know they need, but in which they have absolutely no interest, because they are not yet aware of when and how and why they will ever need those skills and that knowledge. If you gave a damn about learning your multiplication tables in fourth grade, good for you. I can assure you I did not.
Nevertheless, I’ve been getting up and going about my morning looking forward to sitting down and making columns of entries with numbers in a spreadsheet, computing percentages and making a series of preliminary tables that, on the best days, lead to one concise final table that answers the question that started the whole process. And then, I can open the Insert tab in Excel, hit the Recommended Charts button, and voilà! A beautiful colored graph appears next to the table, just like that. If I re-sort the table, it re-draws the graph accordingly. This is delightful! Whodathunkit?
So, as it turns out, tables and graphs are tools—means to an end—and I am learning to appreciate those tools and how to use them because I need what those tools can give me. I’m just compiling numbers and percentages and estimates; I’ve never had a statistics course in my life (“I am not an economic historian…”), but I need that stuff for this book. Those numbers have interesting stories to tell, and I’ve set myself the task of telling those stories.
As a bonus, I get to feel like a “real” historian in a way I haven’t yet, despite my accomplishments. I readily grant that this is a completely idiosyncratic sort of satisfaction; I’ve tried to explain where it came from. Other historians, I’m sure, feel like “real” historians when they first write a piece they feel really good about. We all come to this with different skills, interests, limitations, and prejudices.
I will end by thanking my fourth-grade math teacher, then. He also had a sign on the wall of his classroom that I hated at the time and love now: “If you don’t have time to do it right, when will you have time to do it over?” But that is a topic for a future rumination. If you have just read all this, thank you.
