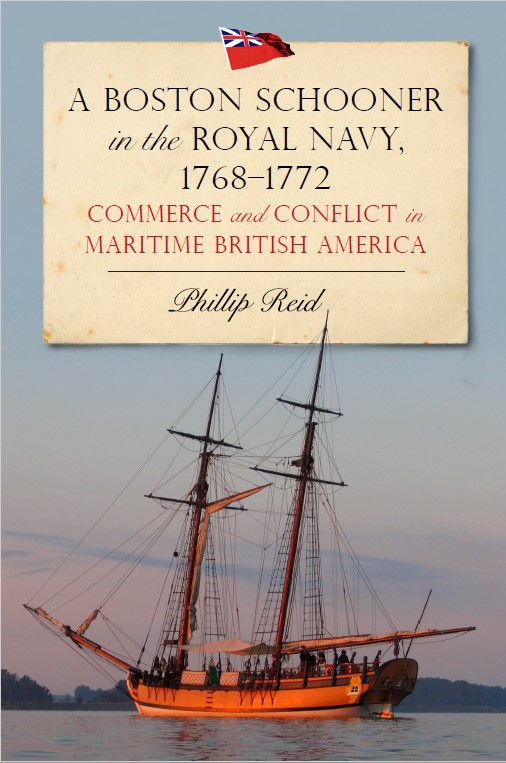
My second book, A Boston Schooner in the Royal Navy, 1768–1772: Commerce and Conflict in Maritime British America (Boydell Press) is out now. To view the book’s page on the publisher’s site, click here (link will open in new window). You can enter the discount code BB135 at checkout for a 35% discount off cover price. Or, you can buy from your favorite bookseller. Or, ask your library to buy it!
We have a release date of 18 April 2023 for the new book. The publisher is accepting pre-orders for the hardcover; they expect those to ship on or just before that date. You can order copies here (link will open in new window).
The publisher’s page for the new book is now up and may be accessed here. (Link will open in new window.) You can reserve a hardcover copy from this page. There is a link on the page for recommending the book to your library for purchase if you’d like to do that. Also, please note that an e-book version will be available in April, when the hardcover is released, at a substantially lower price.
As of early October (I’m writing this on the 26th), Book 2 is in production at Boydell & Brewer. I expect to get proofs from them in the next few weeks, to which I’ll add a paginated index (I’ve already prepared the headings). I still expect it to come out early next year; of course I’ll post a release date when I have one.
My fortnightly short-essay series, Leeway, is now in its fifth month on Substack. If you aren’t subscribed and want to take a look, you can do that here.
Nick Burningham’s and my contribution to a discussion begun in the inaugural issues of the Mariner’s Mirror over a century ago was published online today. It will come out in the print version presently. We present what we consider convincing evidence on the development of common sailing rigs of the eighteenth-century Atlantic, and argue for a link between technological choice in naval and merchant vessels based on merchants’ perceptions of security and prestige. If you want to read it, you can try this link; we have a limited number of “passes through the paywall” from the publisher. If this doesn’t work, and you still want to read it, let me know and I will get on it.
The first article I ever got published, in SAIL magazine, twenty-one years ago, hangs framed on my office wall. I’ve gotten somewhat used to it since then, but it’s still one of the most satisfying things I know, to sign a contract with a publisher. I will admit that it was also nice, with those trade magazines, to get a check in the mail to go with that, which does not happen with academic publishing, unfortunately. Still, I’m sincerely happy to report that I signed a contract for Book 2 on the date above. Based on the publisher’s standard guidelines, I assume it will come out next spring (2023); I will update this page when I find out something more definite, along with other details about the publication.
As far as I know, the manuscript they have is the manuscript they’re going to publish; we are working to finalize the images now.
For any of you reading this who supported this project, thank you. That support has now come to fruition.
I am waiting to hear from three grant apps now; two individual, one group. I should hear on one this month (July), and the other two in December. Meanwhile, I’m working on an article about an American snow on an Atlantic voyage from Delaware to Ireland, and then to the Caribbean during the Napoleonic Wars, where an attempted slaving trip ran afoul of the Royal Navy’s hunters.
First, the second book, A Boston Schooner in the Royal Navy, is under review by a publisher; that process started early January. How long it lasts is impossible to predict. It’s a waiting game. If you’ve supported the project, just know that I will do my very best by the book, and when I have some good news, I’ll post it here as soon as I can.
Meanwhile, I’ve committed to contribute articles to two journals this year. Both are group efforts; I was kindly invited by the researchers on the Global Sea Routes Database Project, based at the University of Trieste, to contribute to their takeover of an upcoming issue of Itinerario; and the second is a roundtable in the International Journal of Maritime History, an outgrowth of the Risk and Uncertainty in the Premodern World seminar series, hosted by the Institute for Historical Research, School of Advanced Studies, University of London, in which I presented in late 2021.
I also have an article, co-authored with Nick Burningham, coming out in the Mariner’s Mirror sometime this year, on the likely origins of the two-masted square rig in British Atlantic shipping. When we have a date, I’ll post it.
I have committed to joining a long-term research project on maritime commercial connections between the Caribbean and the Mediterranean, contingent upon funding from the European Research Council; that application will be submitted by the end of this month. By 15 April, I will have applied for an NEH Fellowship for a book project on the maritime history of colonial North Carolina–for the second time; those applications have about a 7% success rate, which is a sad state of affairs, but the success rate for non-applicants is 0%. More funding for humanities research!
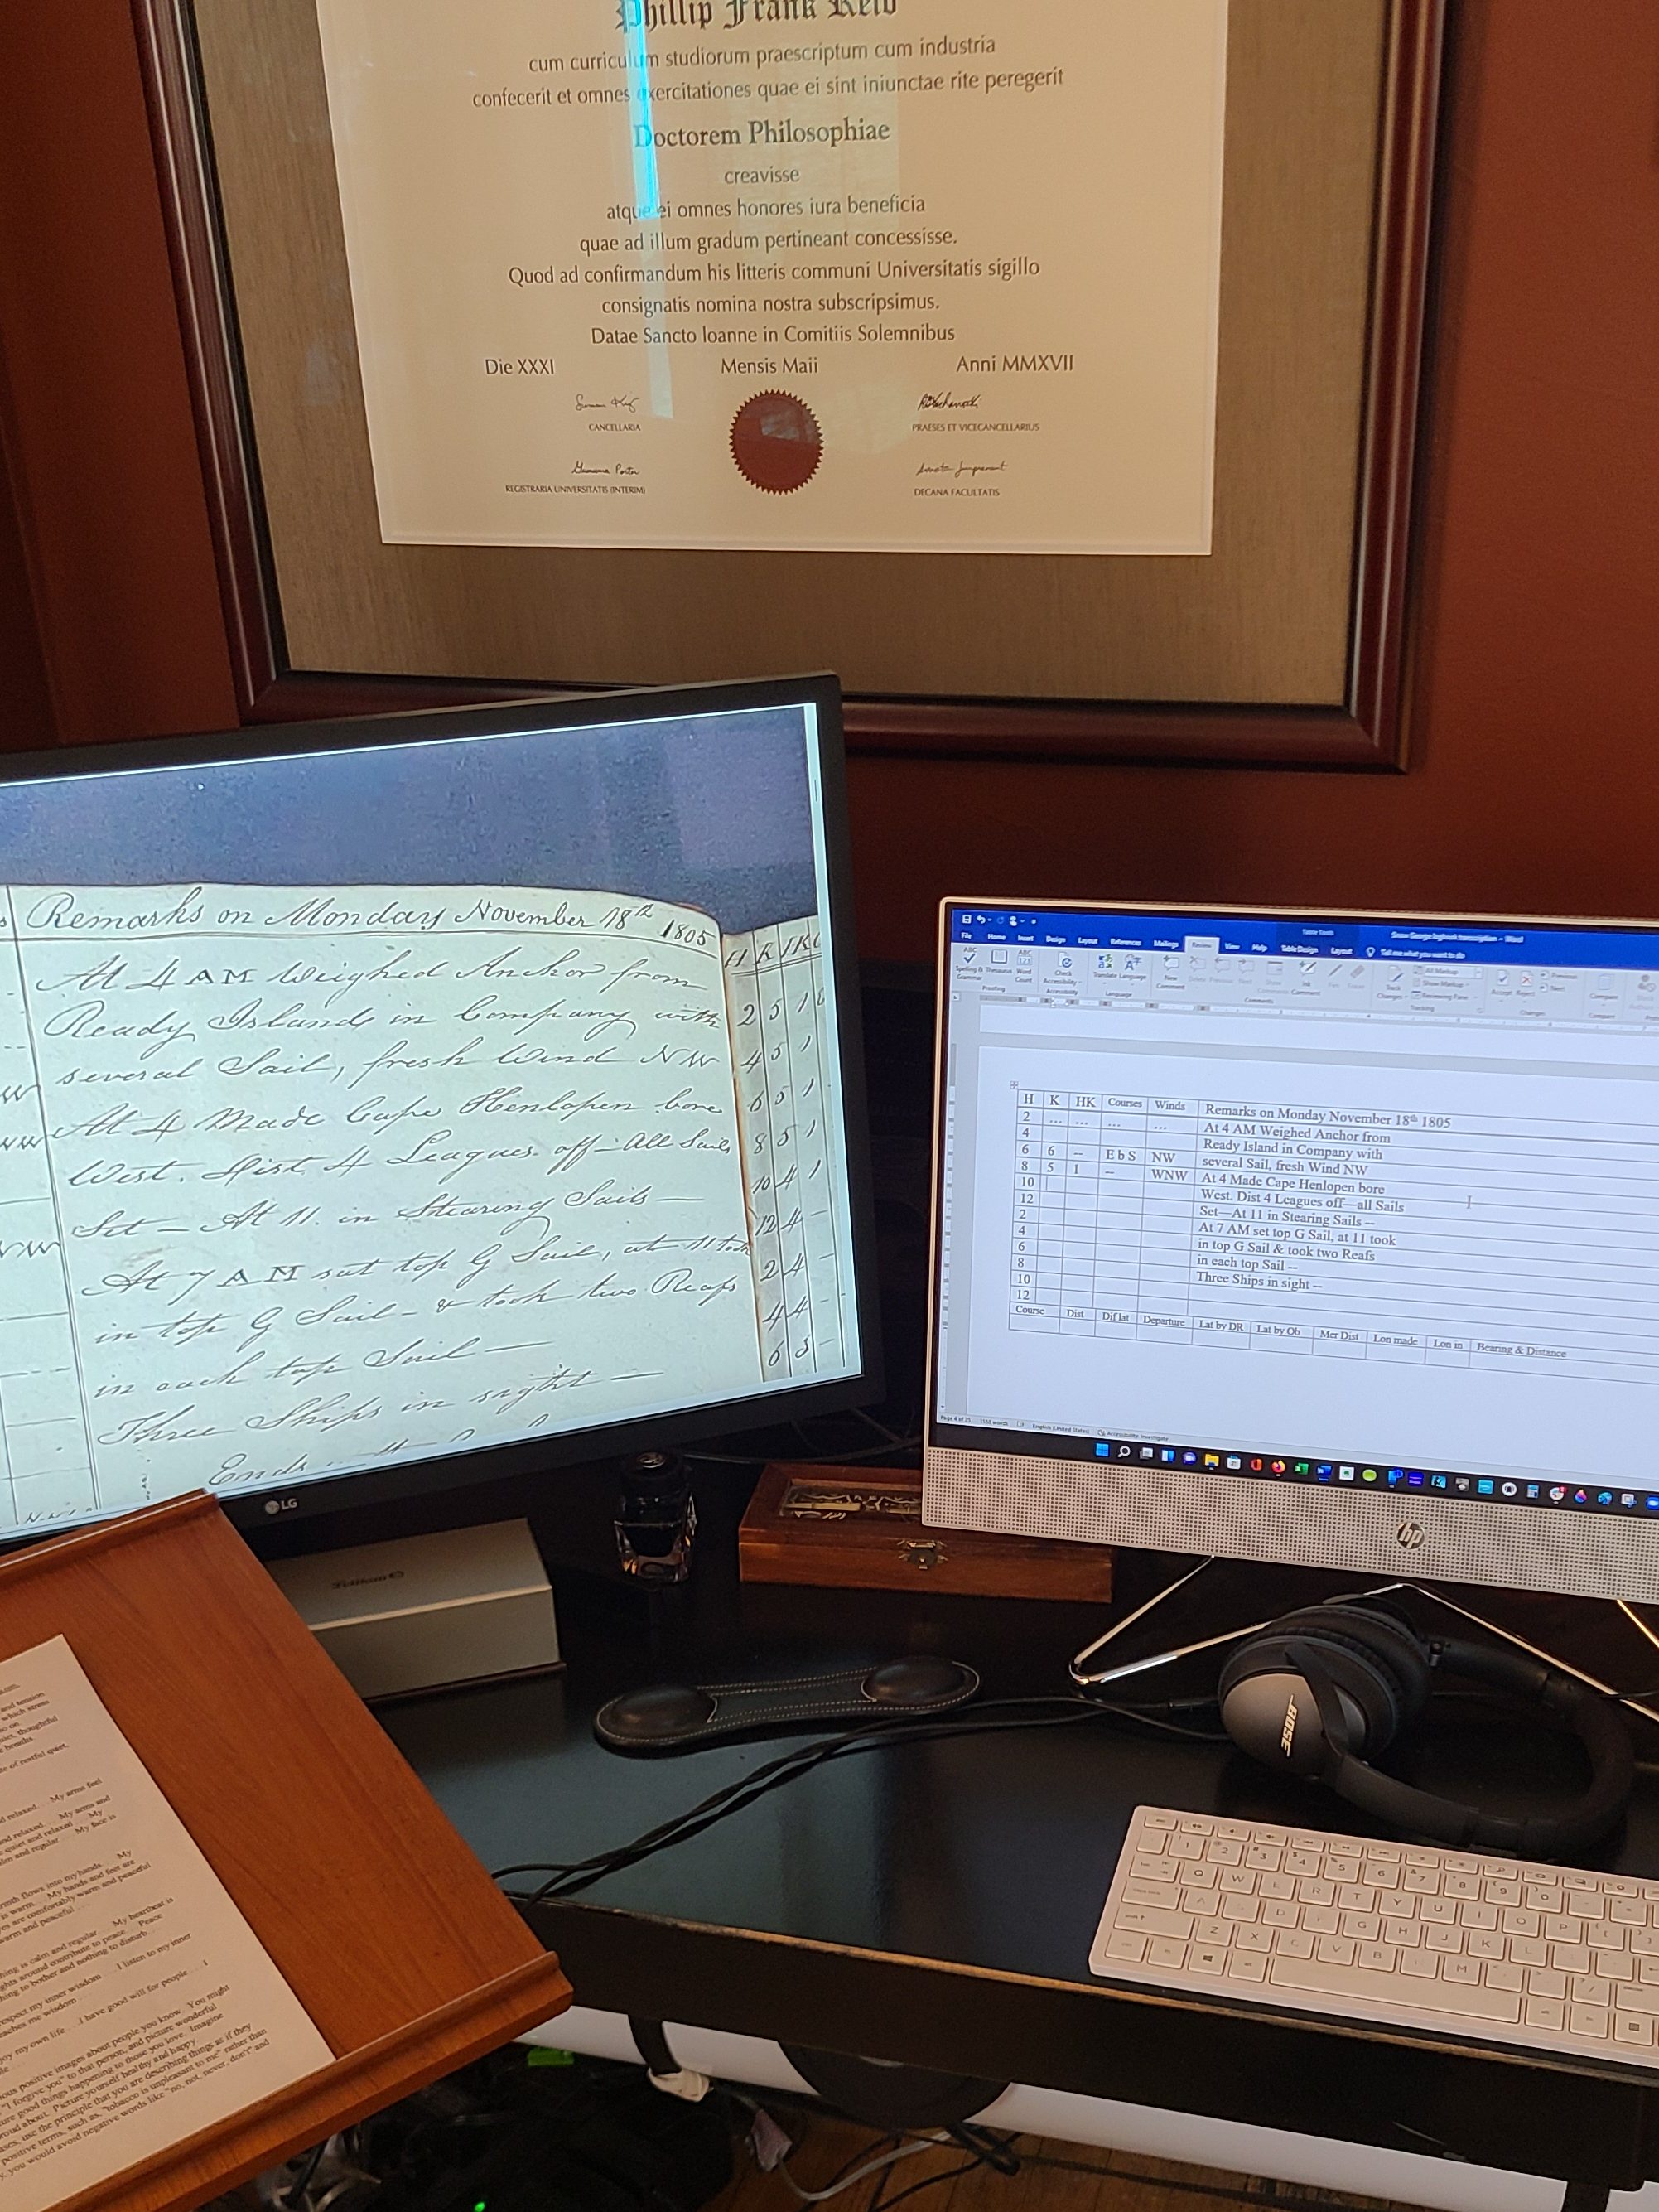
Right now, I’m working on the log of an American snow from 1805–6, procured for me by Prof. Guido Abbatista, principal investigator of the GSR Database Project. Initially, I intended merely to transcribe the log and plot the voyages in GSR, but the more I read, the more I realized that this is a rich source that asks some interesting questions; I have finished the transcription and I’m now deep into researching some of those, from Pennsylvania to Ireland to the Caribbean, and there is certainly a good article to be written from this. Stay tuned on that.
Finally, I’m looking forward to the 2022 North American Society for Oceanic History annual conference, to be held right here in Wilmington, hosted by Cape Fear Community College, where I taught as an adjunct from 2001 to 2011. I was the first to submit my abstract to present, so I’m told, and I’ll be helping out any way I can with the conference. That’s 22-25 June.
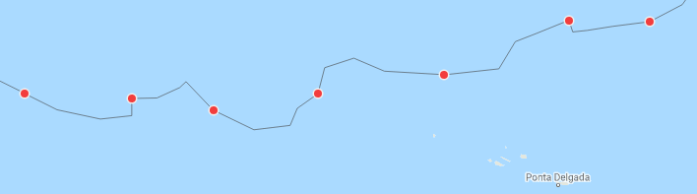
I’ve just finished the North Atlantic crossing of the little schooner at the center of my microhistory-in-progress. Even with the irregular zig-zags representing a sailing vessel’s progress along a track only discernible from a zoomed-out view, the plot, with its crisp, thin black line and red dots at five-day intervals, the visual rendering of this routine death-defying course through some of nature’s most powerful forces looks so precise, so definite.
That is an illusion; the visual representation both reveals and obscures the truth. The historical records upon which the plots are based are the logs of the commander and the master—two different people, each keeping his own journal, such that slight discrepancies are common and irreconcilable inconsistencies occur from time to time. Eighteenth-century ships’ logs are written in table form with labeled columns and consistent conventions for recording, in a special shorthand, the winds, the courses, the day’s run in miles, the estimated position, and the most important occurrences on board that day—sail changes, damage, sightings of other vessels, sightings of land or soundings of the bottom. The logs are neat and orderly, a utilitarian and quotidian human effort to distill what those who made them assumed would be most worth revisiting later—something fixed, in ink on paper, unlike the fickle memories that would not stick in the mind, of experiences so much larger than what was written down but gone forever as soon as they happened. The logs are yet another human attempt to impose order on chaos, written so carefully by someone wedged into a corner of creaking wood, making legible marks on a page by guttering lamp while the vessel that contained him pitched and tossed and rolled and groaned.
The letters and numbers in the log were not only an incomplete record of the day’s reality; they were an imprecise one as well, no matter how skilled the navigator, no matter how benign the conditions in which he worked that day. The compass and the octant, the chip log, and the human hands and brains that worked them all introduced slight deviations from the truth they sought, so that the exact truth—any exactitude at all—remained unattainable. No position ever plotted by an eighteenth-century navigator out of sight of land was exactly where on the surface of the planet his ship was—or, if it was, that was by chance. These navigators knew this. The skill of knowing how much confidence to place in any attempt to determine position was as important as the skill of knowing how to determine that position. Navigators used every means at their disposal to guess at their position—compass heading, corrected for magnetic variation; the angle a celestial body made with the horizon, converted to latitude with the help of an almanac; the speed through the water measured by a chip of wood pulling a knotted cord through a seaman’s hands or floating past the known length of the hull in a certain number of seconds. When currents were detected, they tried to estimate how far, and in what direction, the current might be setting them off course. Cloud patterns, sea birds, and—close to the coast—the depth and composition of the seabed could warn of approaching land. When, as was inevitable, the various techniques pointed the navigator toward slightly differing positions, it was up to his judgment to determine the best estimate. Even now, the positions we call “fixes”—those upon which we have the highest level of confidence—are marked by a dot surrounded by a small circle, because every navigator knows there is no such thing as a fixed point in the sea.
Plotting a voyage from 1768, using a geo-referencing application probably invented a decade ago, forced judgment calls at every point. At the entrance to the English Channel, the wind forced the schooner southward, toward Brest, France. The latitude and longitude recorded for that day put them in Brest, France. We know that’s wrong, but how wrong? We can use recorded bearings to known points, and distances from those points—accepting that those are estimates, made by experienced eyes and judgements, not precise instruments. The plot I made of that day’s run preserves the reality of the southward push, and the approximate location of the schooner’s track relative to the coasts of England and France, and relative to the following segment of the route. I make no claim that the schooner was ever exactly on any point of the track as I have plotted it. To counter the visual illusion that she was, I made notes for each segment, and when I reproduce the image in the book, those notes will be keyed to the red dots, and they will explain the uncertainties, the judgment calls, and how I used the source material to make those judgement calls about those uncertainties.
That these plots are valuable history despite their limitations is beyond question. They illustrate, as the words and numbers upon which they’re based cannot, the reality of crossing an ocean in a vessel that could neither sail anything close to directly into the wind, nor make progress against too high a sea. They remind the observer that, for their own reasons, groups of people routinely sent other groups of people out to sea to face the autumn gales of the North Atlantic from England to America on small wooden vessels sailing against the prevailing winds and currents. It took my little schooner two months to cross the North Atlantic that autumn. Looking at that plot shows you, rather than tells you, why. That’s why it’s worth using all the source material at hand, all the skills and experience I can bring to understanding what that material is telling me, and all the brain work required to make the judgement calls necessary to produce the best interpretation I can out of what I have. The result will never be—can never be—perfect. History is the craft of applying experienced judgment to all the relevant source material we can find. History can never perfectly present the past. That’s not why we do it. We do it because it is far better to have a good approximate idea of where we have been and where we are going than to have no idea at all.
When I was training to be a historian, I suppose starting with MA work, I managed to internalize the notion that “real” historians crunched data, drew conclusions from it, and presented it to their audience in the form of tables and graphs. One thing that most of the “real” history books I was assigned to read had in common was lots of tables and graphs. It would be reasonable to assume, then, based on what I just wrote, that I began to pay special attention to these tables and graphs, with a growing ambition to create my own as I developed into a “real” historian myself.
Reasonable such an assumption might be. It would also be wrong. I disliked tables and graphs. I never read them. My attitude was—and to some extent, still is—that the author had better tell me what conclusions are to be taken away from the tables and graphs without my actually having to peruse them. When I read a book, I want to read words strung together in well-crafted English. I do not want to look at numbers and make my brain do math.
The next reasonable assumption might be then, that I had a problem: I was training to be a “real” historian, I had internalized that “real” historians do research that results in tables and graphs, and yet I disliked tables and graphs, and thus was unlikely to want to do research that would lead to my producing them. This assumption would be correct. As superficial as it may come across, I think that helps explain why thirteen years passed between finishing my MA and beginning my PhD.
Doctoral training is, of course, literally on a whole other level, so I learned that “real” historians do all sorts of things, and by no means must one do the sort of research that leads to the production of tables and graphs. Nevertheless, as my study progressed, I realized that where it was headed was a shelf of books full of—yep—tables and graphs, so much so that I found myself often having to say to myself in my head, “I am not an economic historian, I am not trying to become an economic historian.” That was important, as I have had precisely one economics course in my academic career, as a college sophomore, and my performance in it was less than remarkable.
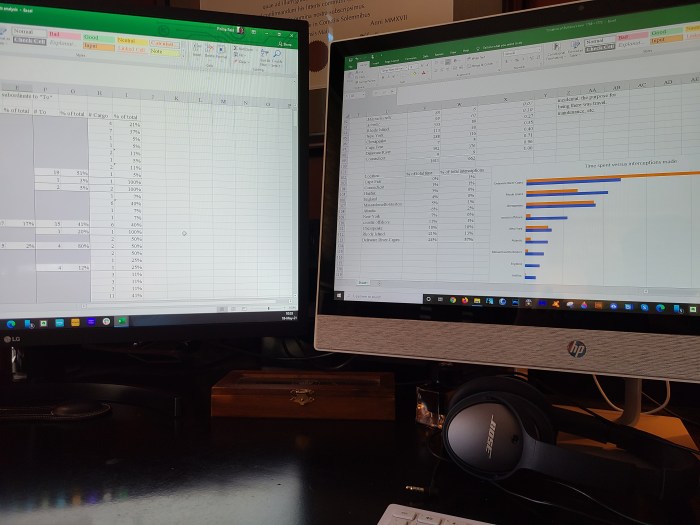
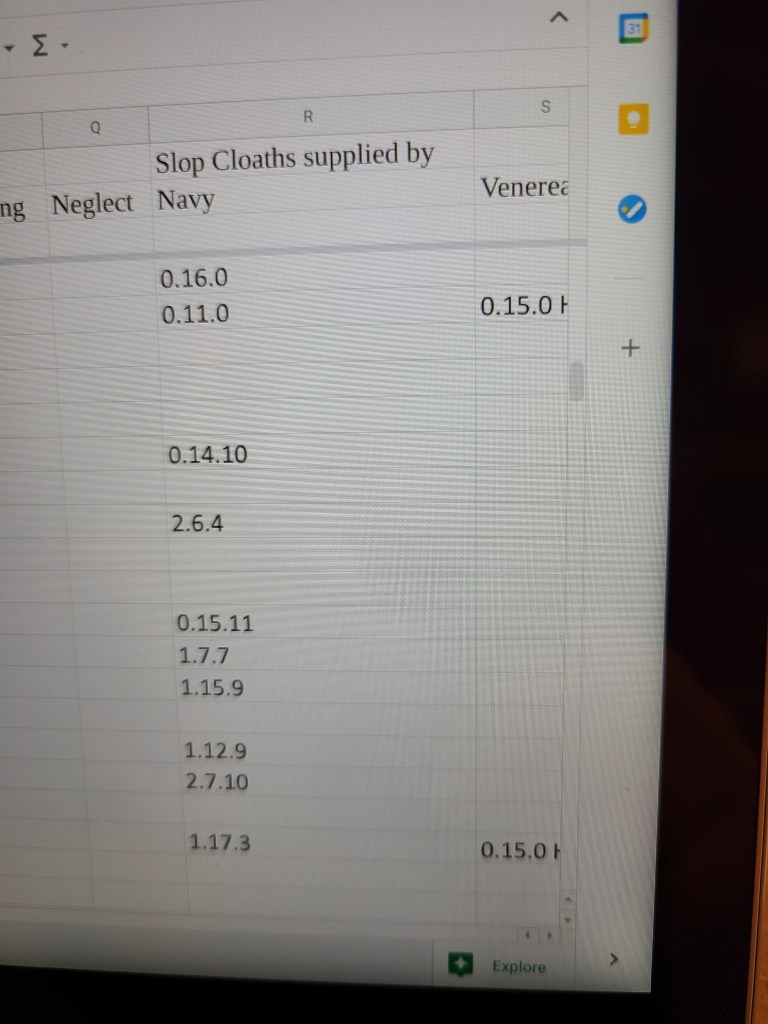
I found my way, and here I am, five years out, in the late stages of research for this second book. I’m still not an economic historian and have no ambition of becoming one. Yet, as you can see from the image that accompanies this post, I am sitting here producing—tables and graphs. What’s weirder than that is how much I am enjoying it.
I think this is best explained by an adage that has proved among the more generally applicable to life so far as I can tell. It can be expressed something like this: It’s striking how one can suddenly develop a keen interest in learning and using a skill for which, in the past, one had no such interest, when that skill proves necessary to accomplish something about which one actually gives a damn. I think this also gets at a perennial problem of pedagogy: trying to teach students skills and knowledge you know they need, but in which they have absolutely no interest, because they are not yet aware of when and how and why they will ever need those skills and that knowledge. If you gave a damn about learning your multiplication tables in fourth grade, good for you. I can assure you I did not.
Nevertheless, I’ve been getting up and going about my morning looking forward to sitting down and making columns of entries with numbers in a spreadsheet, computing percentages and making a series of preliminary tables that, on the best days, lead to one concise final table that answers the question that started the whole process. And then, I can open the Insert tab in Excel, hit the Recommended Charts button, and voilà! A beautiful colored graph appears next to the table, just like that. If I re-sort the table, it re-draws the graph accordingly. This is delightful! Whodathunkit?
So, as it turns out, tables and graphs are tools—means to an end—and I am learning to appreciate those tools and how to use them because I need what those tools can give me. I’m just compiling numbers and percentages and estimates; I’ve never had a statistics course in my life (“I am not an economic historian…”), but I need that stuff for this book. Those numbers have interesting stories to tell, and I’ve set myself the task of telling those stories.
As a bonus, I get to feel like a “real” historian in a way I haven’t yet, despite my accomplishments. I readily grant that this is a completely idiosyncratic sort of satisfaction; I’ve tried to explain where it came from. Other historians, I’m sure, feel like “real” historians when they first write a piece they feel really good about. We all come to this with different skills, interests, limitations, and prejudices.
I will end by thanking my fourth-grade math teacher, then. He also had a sign on the wall of his classroom that I hated at the time and love now: “If you don’t have time to do it right, when will you have time to do it over?” But that is a topic for a future rumination. If you have just read all this, thank you.
On Thursday evening, we arrived safely back home from the second research trip to Chestertown, Maryland, to examine the remainder of the log books and the muster books. If you don’t know what this is about, here is a brief run-down; see earlier posts for more. I’m working on a “microhistory” based on the four-year cruise of HM Schooner Sultana, built at Boston in 1767 and taken into the Royal Navy the following year at Deptford naval yard just outside London. The detailed records kept by the Navy allowed for an accurate reconstruction of the little vessel (she is, we think, the smallest vessel ever commissioned in the Royal Navy), and the new Sultana was launched in 2001. She is owned and operated by the Sultana Education Foundation of Chestertown, Maryland, which owns complete copies of all the master’s and commander’s logs and the muster books (lists of crew and their statuses) for the entire cruise, July 1768 to December 1772.
On the first trip, in September 2019, I completed the master’s logs, got about 10% of the commander’s logs, and looked at the muster books enough to know what they contained and how to approach examining them. From the master’s logs, I spent almost three months of full-time work extracting and analyzing sailing data, as well as instances of interception; Sultana‘s role was as a customs interceptor, helping to enforce customs duties and interdict smugglers at British American ports on the Eastern Seaboard, from Halifax to Cape Fear (where I live).
On this trip, I finished it all. (Well, almost; I took high-res images of what I didn’t have time to go through, and I’ll do that here at home.) Working was a little bit different this time; to keep me out of the main building for health reasons, SEF set me up in the rigging shop, at a long work table. I worked through the documents where several of Sultana‘s tackles were hanging, their blocks having been freshly varnished. Below, on the main shop floor, some of her spars rested on saw horses, awaiting fresh coats of paint. Her topsails and yards, wrapped in plastic, hung high up from the walls for the winter.
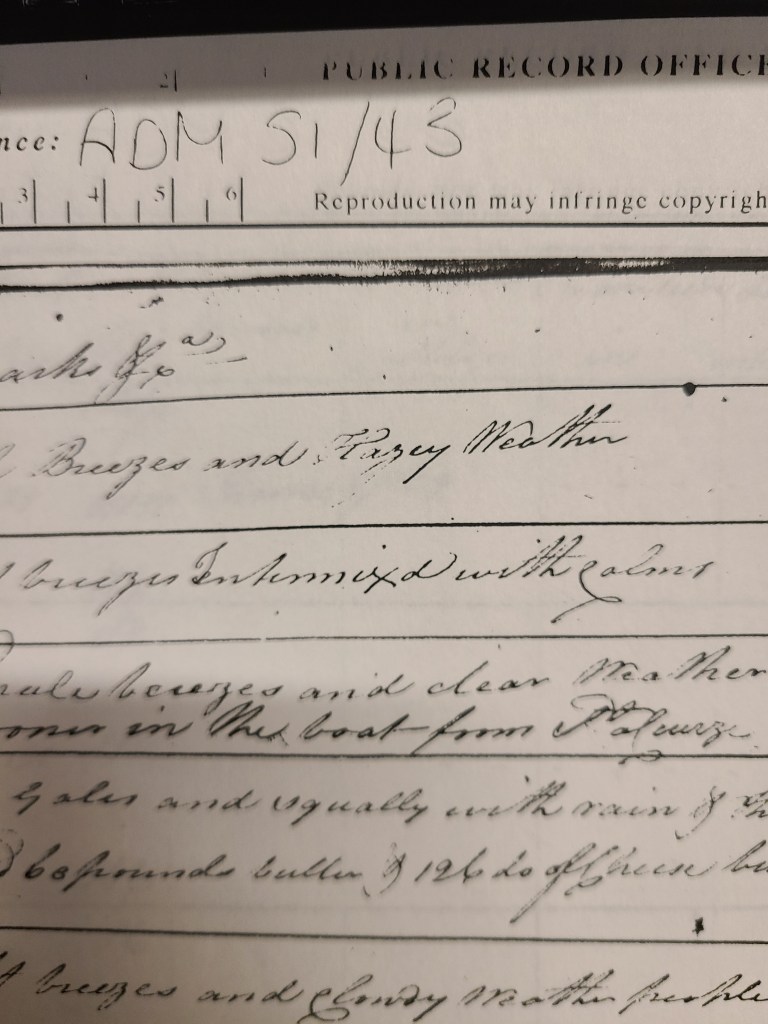
The President of SEF also made copies of his copies of two student papers on provisioning and clothing, as well as a complete copy of his copy of the sailing directions for various American ports, written in commander Lt. John Inglis’ own hand. (Fortunately, his hand is unusually neat.)
I want to thank Drew McMullen, the aforesaid President, for this and all his help, without which this project would never have started. I want to thank Aaron Thal, Sultana‘s captain, for the interview he sat down for via Skype before we went up, and for his logistical assistance in getting the heat set right and lending me some keys, and generally making me feel welcome. Most of all, I want to thank my patrons, whose donations made this trip possible, and the National Coalition of Independent Scholars, for the Research Grant.
I’ll be working through this stuff over the next two to three months, and I’ll post updates here. I hope to have an edited draft of the book this summer. Stay tuned, and thanks for reading.
Exactly three months ago, I started transcribing the sections of Sultana’s master’s logs recording her ocean passages—156 days total, from August 1768 to early December 1772, for the purpose of extracting all the data and information on her sailing performance that I could possibly wring out of them. Ultimately, this project generated 38 separate summary documents and spreadsheets, the records of processing this information through multiple stages of analysis. I also plotted the wind directions and Courses Made Good for each of the 156 days on a 360-degree compass card pasted into 156 individual Word documents. Tomorrow, I am going to read a book. (“Required reading” for the project, but still, it’ll be nice to look at a different set of black characters on a white background for a few days.)
Working with this data brought up the basic challenges of trying to extract information from most historical sources. Those challenges start with this basic one: the source was not created for you, or with your agenda in mind. Whoever created it did so for their own reasons, and it’s highly unlikely it ever occurred to them that a historian three hundred years later would have the slightest interest in it. David Bruce’s log was written as standard procedure for the master of a vessel in the eighteenth-century British Atlantic, not for me. That set me up for the following basic challenge. My ultimate hope was to learn what sails Sultana was flying on what points of sail (angles to the wind), and in what wind strengths. This is the core of sailing performance, especially when the day’s progress is recorded, which in a log, it is. Unfortunately, I had to go about approaching this task in an oblique way, as the log only tells me some of what I want to know.
Generally, the log records three to four wind directions for the 24-hour day (noon to noon); North Atlantic weather is more fickle than steady. It also records between one and five wind strengths, along with other weather conditions—such as “moderate” or “strong gales and squally.” The third element of the equation is a Course Made Good (CMG) for the entire day’s run. Problem Number One is that the correlations between wind direction and wind strength are rough rather than exact. Much of the correlation must be inferred, by considering all the information presented. Problem Number Two is that only the day’s CMG, not the individual courses steered, is presented. So, if the wind came from three different directions that day, and it’s clear from the Remarks column that the crew made several sail changes indicating more than one point of sail, then we can assume that more than one course was steered. In order to know precisely the point of sail Sultana was on at any given time, we need to know what course she was steering when the wind was coming from a specific direction. The log rarely gives us that. So, plotting her points of sail meant plotting wind directions and CMG for the day, and inferring the points of sail from the angles of those wind directions to the CMG. Those inferences are, by necessity, approximations.
Problem Number Three is that Bruce is clearly inconsistent in recording sail changes. This is perfectly understandable. He was sailing master of a small vessel with 25 crew aboard, trying to stay alive and afloat in the unforgiving North Atlantic in all the wrong months of the year. He had much to do. He records that he reefs sails that he has not recorded ever setting. He lets one or more days pass without recording any sail sets or changes, yet then makes a remark that makes it difficult to assume that his sail plan was simply carried on from the last entry. Again, inferences must be made, and the unavoidable element of guesswork must be accepted.
So, in the end, my tables of percentages to the first decimal point would be most misleading if I did not qualify them with disclaimers like these; they imply a degree of precision of interpretation that is simply beyond our grasp at this point. We can say the same about so many such quantitative exercises in history—perhaps most of them. We have to take care not to ask more of our analyses than they can provide, and we must make clear to our readers what we have done, what assumptions we have made, and why.
Having said that, I am excited about what my analyses ultimately suggest. I am fortunate in that I should have the opportunity to discuss the results with the captain of the current Sultana; insights from his experience should clarify much of the uncertainty that remains, though even then, there are sure to be judgment calls of Bruce’s whose reasoning will elude us. We cannot, in the end, get inside another person’s mind. We can only know what they thought to tell us. Even then, that’s only what they wanted to record, or their own understanding of why they did what they did, and there’s likely even more to it than that. But that is a discussion for another post.